 FieldCamp
Estimate Views & Analytics | FieldCamp
Switch between table, kanban, and analytics views for your estimates and quotes. Track conversion rates, pipeline value, and approval trends in FieldCamp.
Under the hood — see how Estimates & Invoices work in the FieldCamp data model: the fields they hold, how they connect to your other records, and how to customize them.
FieldCamp gives you three ways to view your estimates (quotes): a sortable table, a drag-and-drop kanban board, and an analytics dashboard. Switch between them using the view icons on the right side of the Estimates screen.
Table View
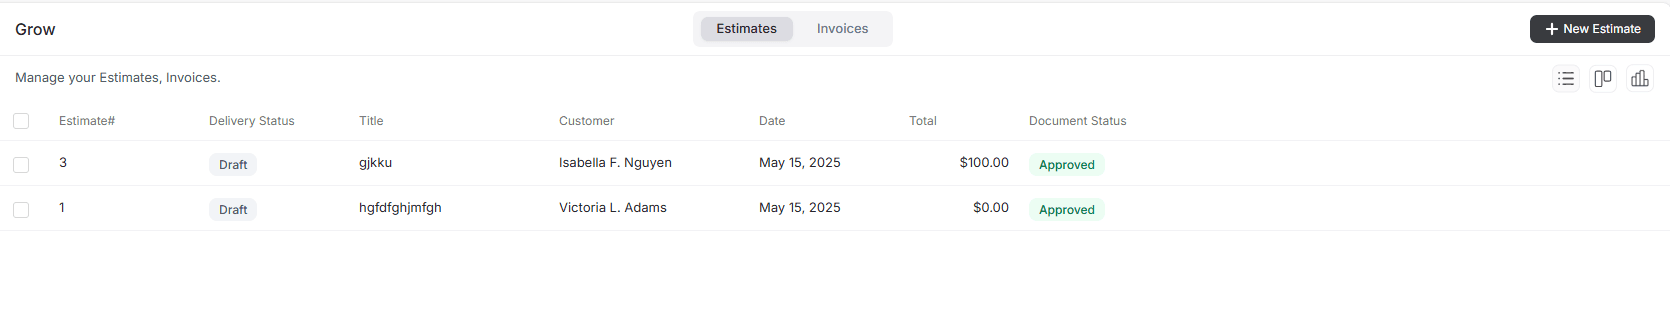
The default table displays every estimate with these columns:
| Column | What it shows |
|---|---|
| Estimate # | Unique identifier (e.g., EST-2024-0001) |
| Title | Internal description of the work |
| Customer | Client name (links to their profile) |
| Date | When the estimate was created |
| Total | Quoted amount including tax |
| Status | Draft, Sent, Viewed, Approved, Rejected, or Expired |
Filtering and Sorting
Use the filters at the top of the list to narrow results:
- Status -- Show only Pending, Approved, Rejected, or Expired
- Date range -- This week, this month, or a custom range
- Client -- Filter by a specific client
- Amount -- Sort by highest or lowest value
- Team member -- Filter by who created the estimate
You can also use Universal Search to find any estimate by number, client name, or description.
Kanban View
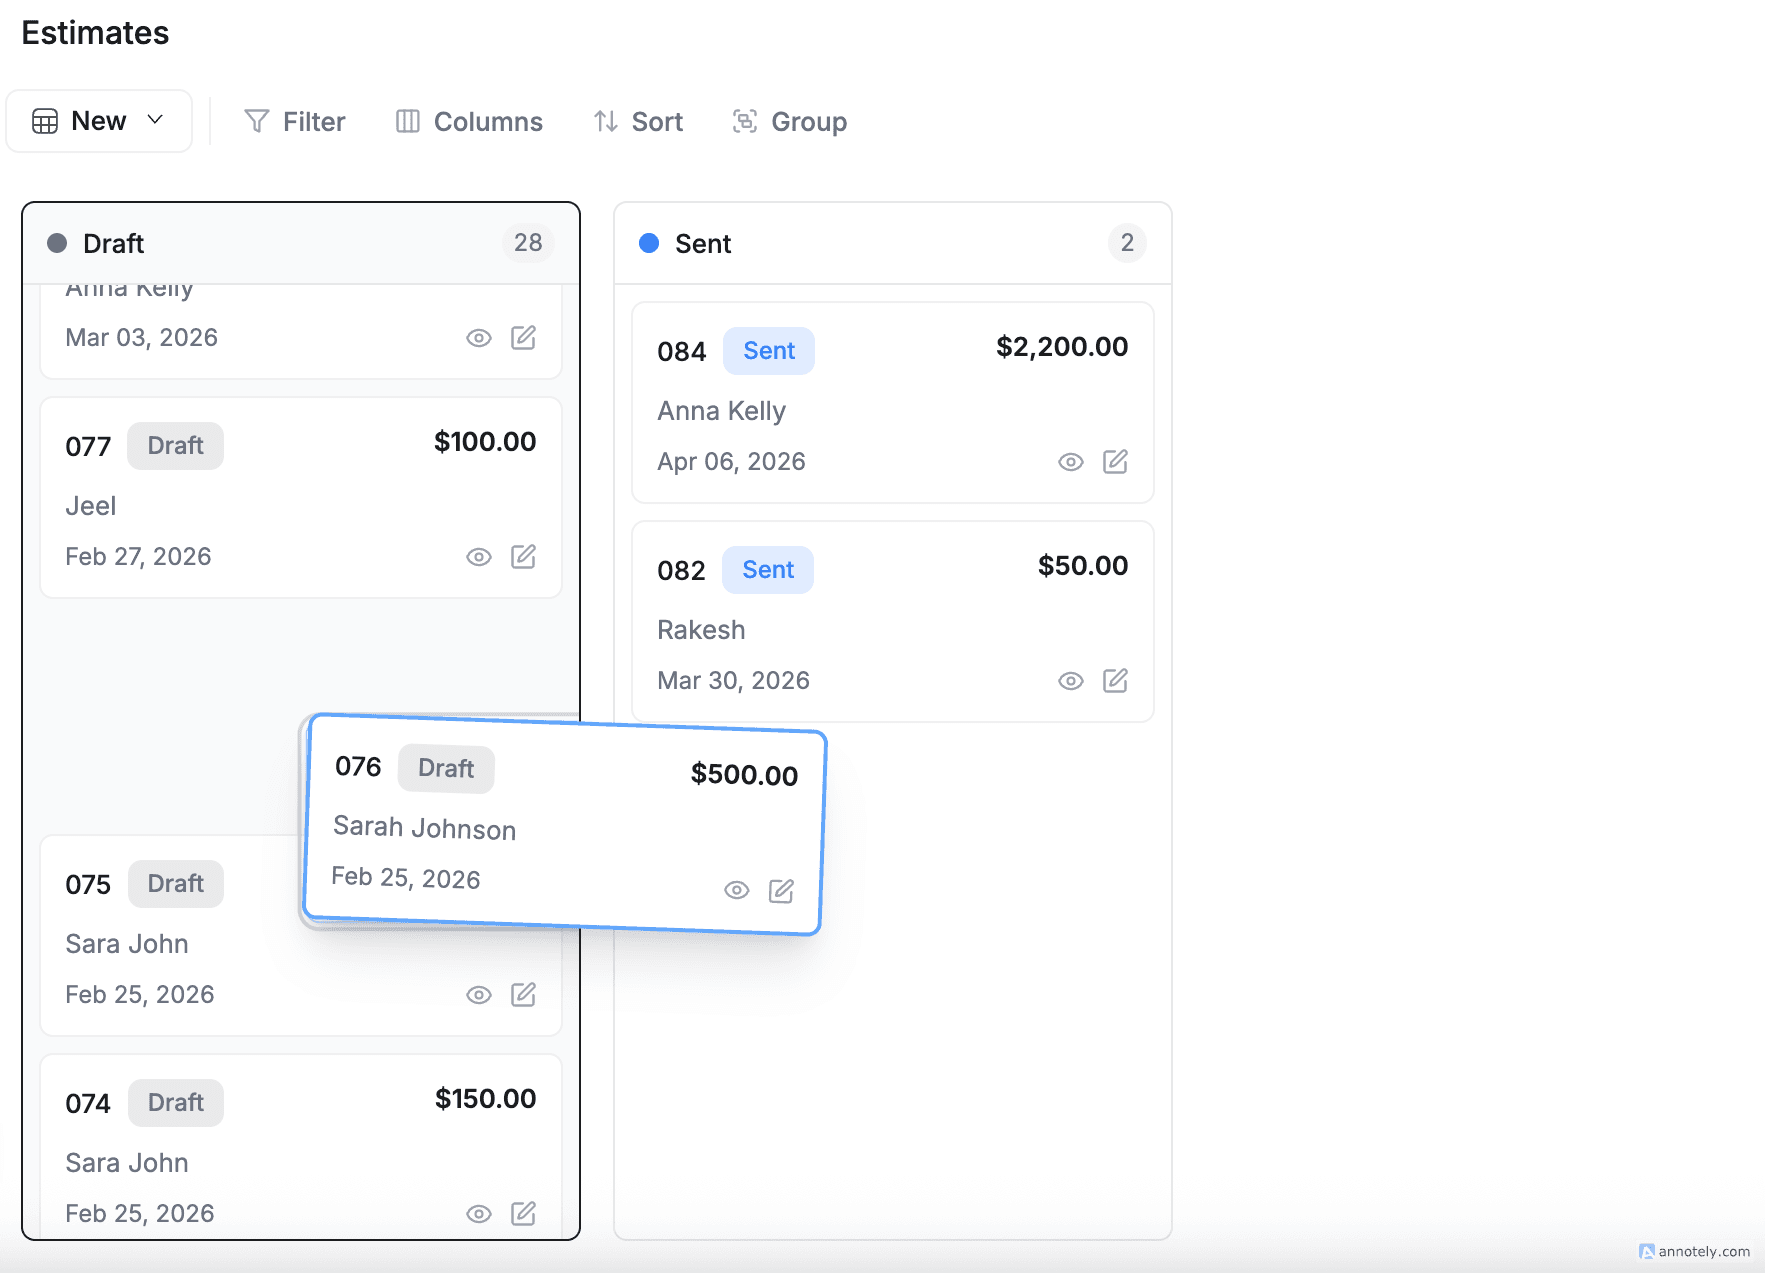
The kanban board organizes estimates as cards in status columns:
- Approved -- Ready to convert to jobs
- Pending -- Waiting for client response
- Rejected -- Declined by the client
Drag and drop a card between columns to update its status instantly. This view makes it easy to see your entire pipeline at a glance and identify bottlenecks.
Analytics Dashboard
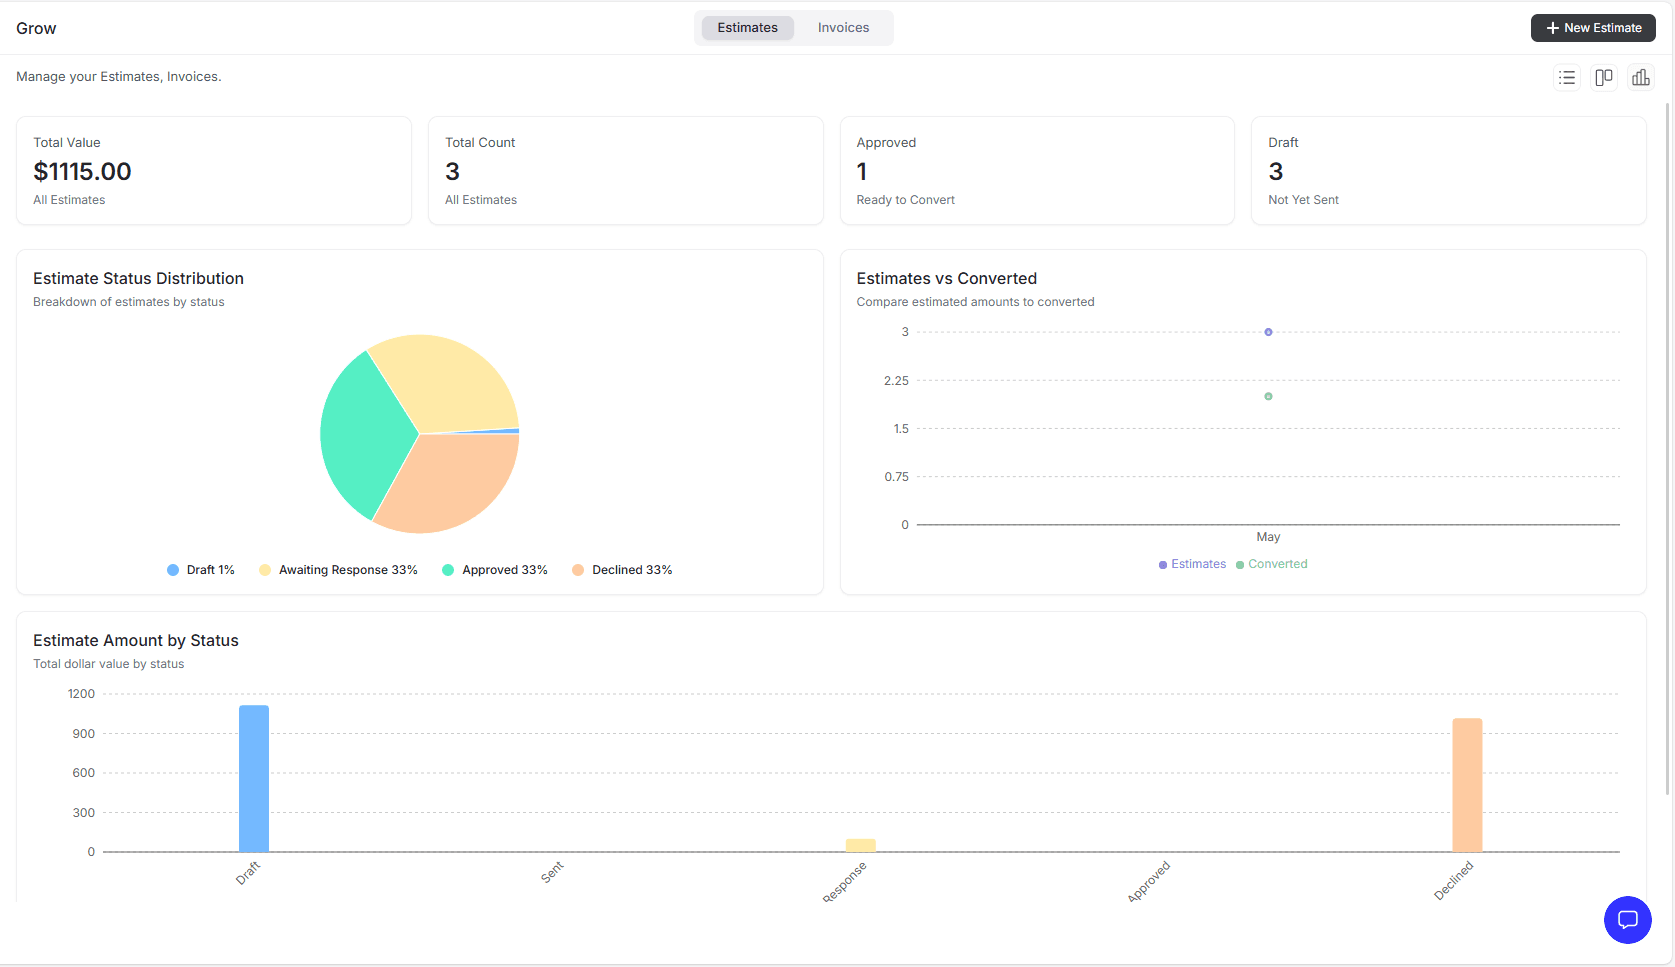
The analytics view gives you a data-driven snapshot of your estimating performance.
Top Metrics
| Metric | What it measures |
|---|---|
| Total Value | Combined dollar amount of all estimates |
| Total Count | Number of estimates created |
| Approved | Estimates accepted and ready to convert |
| Draft | Estimates not yet sent |
Charts
Estimate Status Distribution
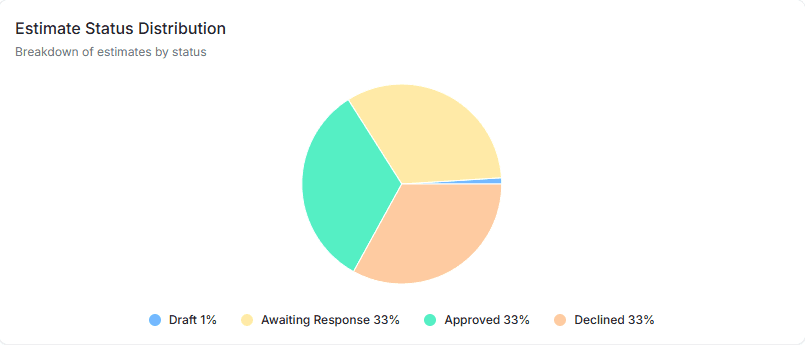
A pie chart breaking down your estimates by status -- see at a glance how much of your pipeline is pending vs. approved vs. rejected.
Estimates vs. Converted
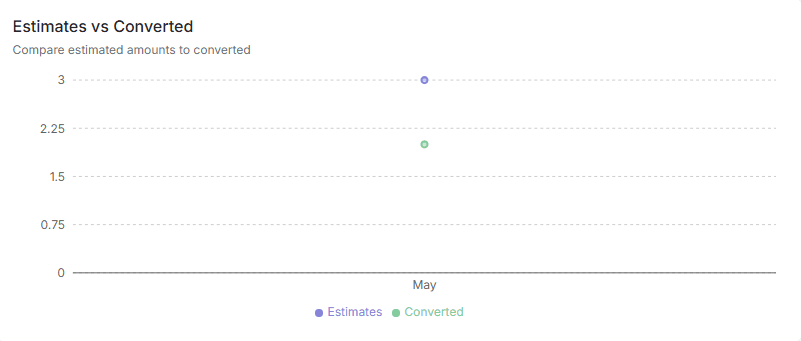
A bar chart comparing the total value of all estimates against those that converted into jobs or invoices. Use this to track your quote-to-job conversion rate over time.
Estimate Amount by Status
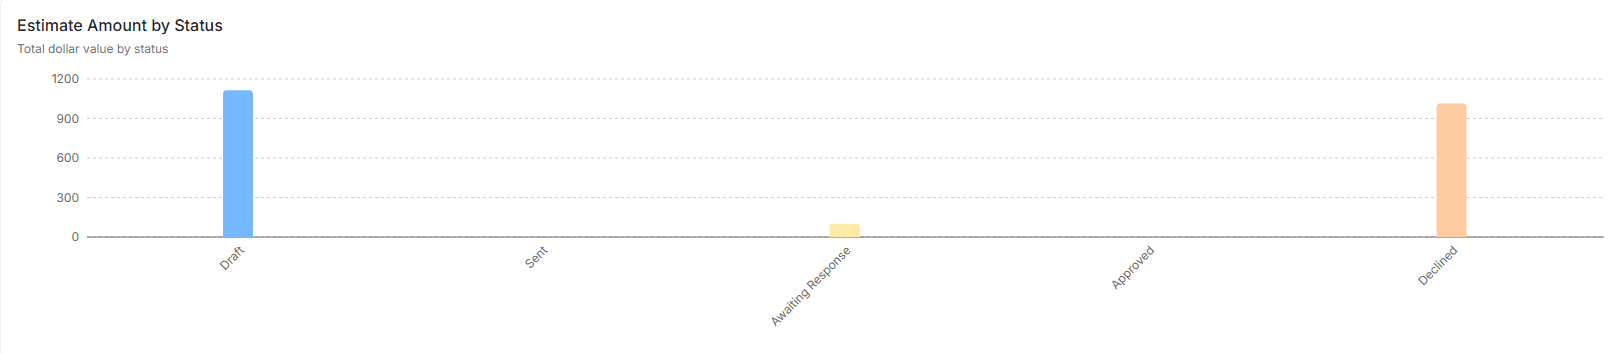
A graph showing the total dollar value grouped by status -- Draft, Sent, Awaiting Response, Approved, and Declined. Spot where money is sitting in your pipeline.
Use the analytics dashboard weekly to identify slow-moving estimates. If a large quote has been in Pending status for more than a few days, follow up with the client or ask the Command Centre to send a reminder.
Exporting Estimates
From the table view, select estimates and click Export to download a CSV or Excel file. Export includes all columns visible in the table -- useful for reporting or importing into external accounting tools.
Related Articles
- Creating Estimates — build and send professional quotes step by step
- Estimate Options and Templates — multi-option estimates and reusable templates
- Estimate to Job to Invoice — the full conversion workflow
- Invoice Views and Analytics — track invoicing performance
- Analytics Overview — business-wide dashboards and reports
Estimate Options & Templates | FieldCamp
Create multi-option estimates and quotes in FieldCamp so customers can choose between pricing tiers. Save option templates for reuse across all estimates.
Creating Invoices | FieldCamp
Create invoices in FieldCamp from jobs, estimates, or from scratch. Add line items, apply tax rates, send by email, track payments, and get paid faster.