 FieldCamp
Custom Dashboards & Boards | FieldCamp
Build custom dashboards in FieldCamp using boards. Add charts, stat cards, and tables to create role-specific views for owners, dispatchers, and managers.
Under the hood — the FieldCamp data model shows how every record connects, how you can customize it, and how it maps to your trade.
Boards let you build custom dashboards that show exactly what matters to your role. Instead of relying on the default Analytics Overview, create focused dashboards — one for tracking revenue, another for monitoring daily dispatch, a third for team performance reviews.
The Fastest Way: Ask the Command Centre
Open the Command Centre and describe the dashboard you want:
- "Create a dashboard showing this month's job completion rate"
- "Add a revenue trend chart to my Owner Dashboard board"
- "Show me my boards"
The AI creates the board, adds the right widgets, and saves it — no manual setup needed. See AI Skills for more examples.
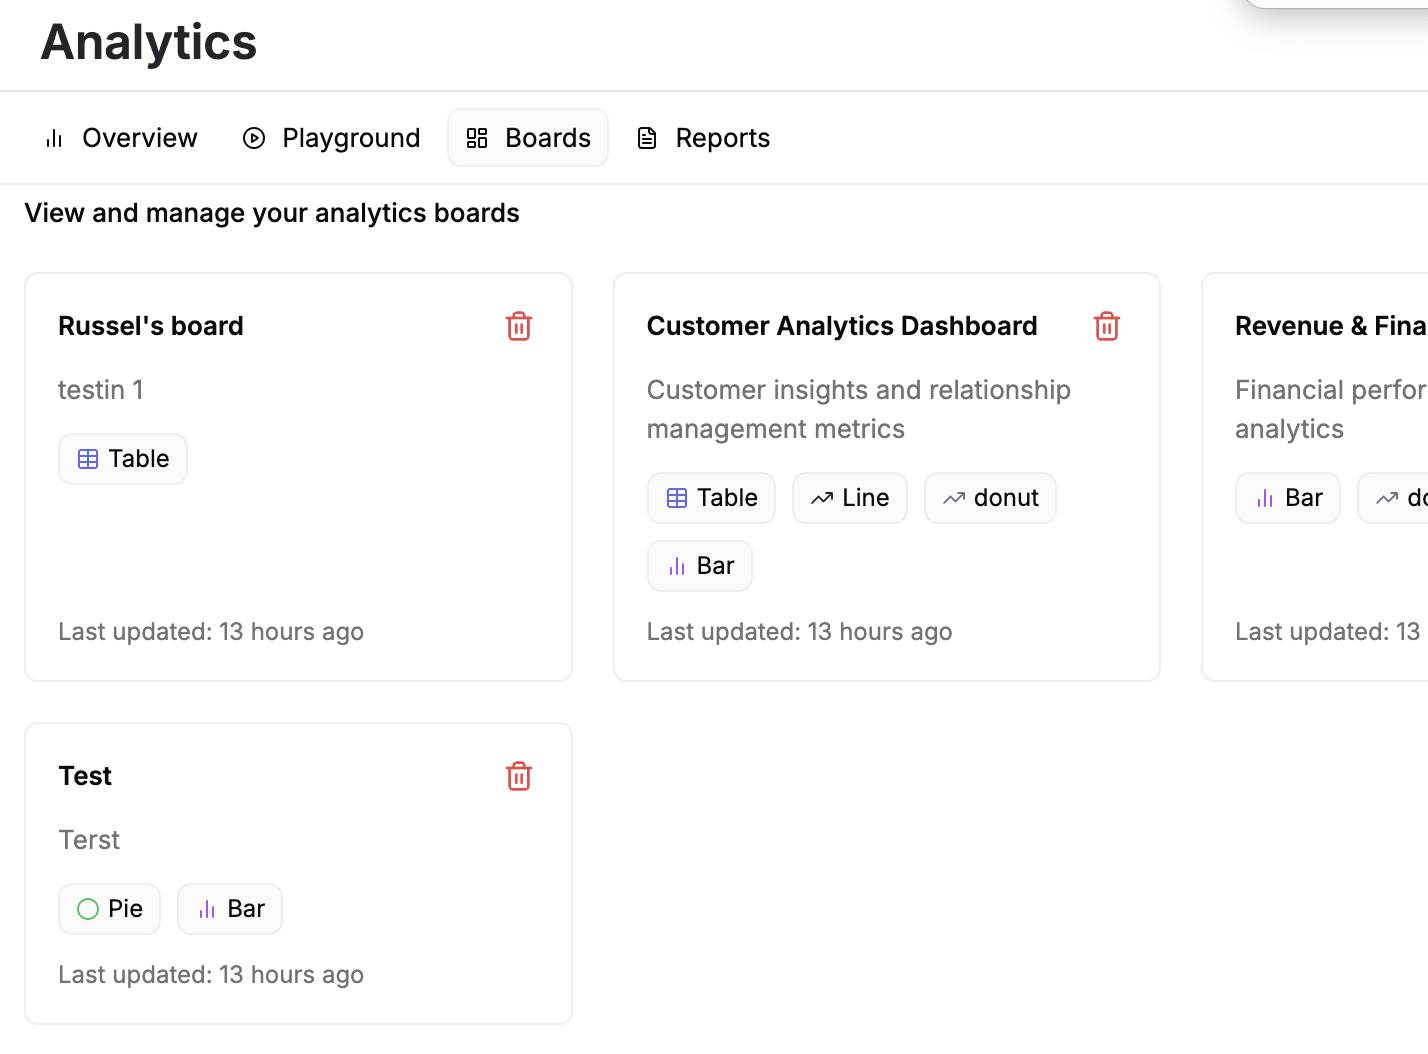
What Is a Board?
A board is a saved collection of charts and widgets arranged on a single page. Each board has a name, an optional description, and one or more widgets that display different slices of your business data.
Think of boards as custom control panels. You decide what goes on them, and they update automatically as new data flows in.
Creating a Board
Step 1: Open Boards
- Navigate to Analytics from the sidebar
- Click the Boards tab
- Click + Create New Board
Step 2: Name Your Board
Give it a descriptive name that reflects its purpose:
- "Morning Dispatch View"
- "Weekly Revenue Tracker"
- "Q2 Team Performance"
Add an optional description so other team members understand what the board tracks.
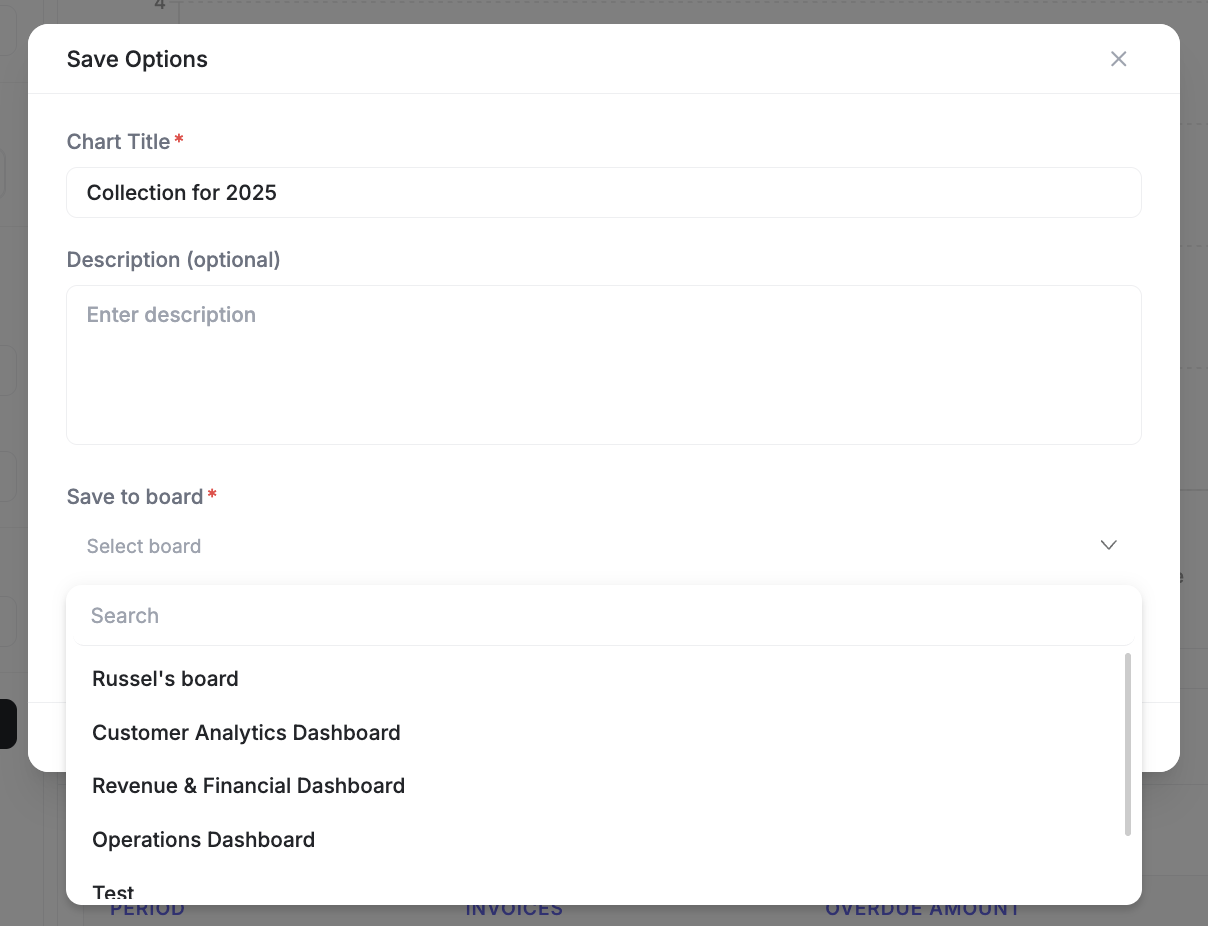
Step 3: Add Widgets from the Playground
- Switch to the Playground tab
- Build a chart by selecting a metric, chart type, and filters
- Click Save to Board
- Select the board you just created (or create a new one from here)
- Repeat for each widget you want on the board
Widget Types
Boards support several widget types, each suited to different kinds of data:
| Widget | Best For | Example |
|---|---|---|
| Bar Chart | Comparing categories side by side | Jobs completed per team member |
| Line Chart | Tracking trends over time | Monthly revenue growth |
| Pie Chart | Showing proportions of a whole | Job status distribution |
| Stat Card | Highlighting a single number | Total revenue this month |
| Table | Listing detailed records | Top 10 clients by job count |
Mix and match widget types on a single board to get both high-level summaries and detailed breakdowns.
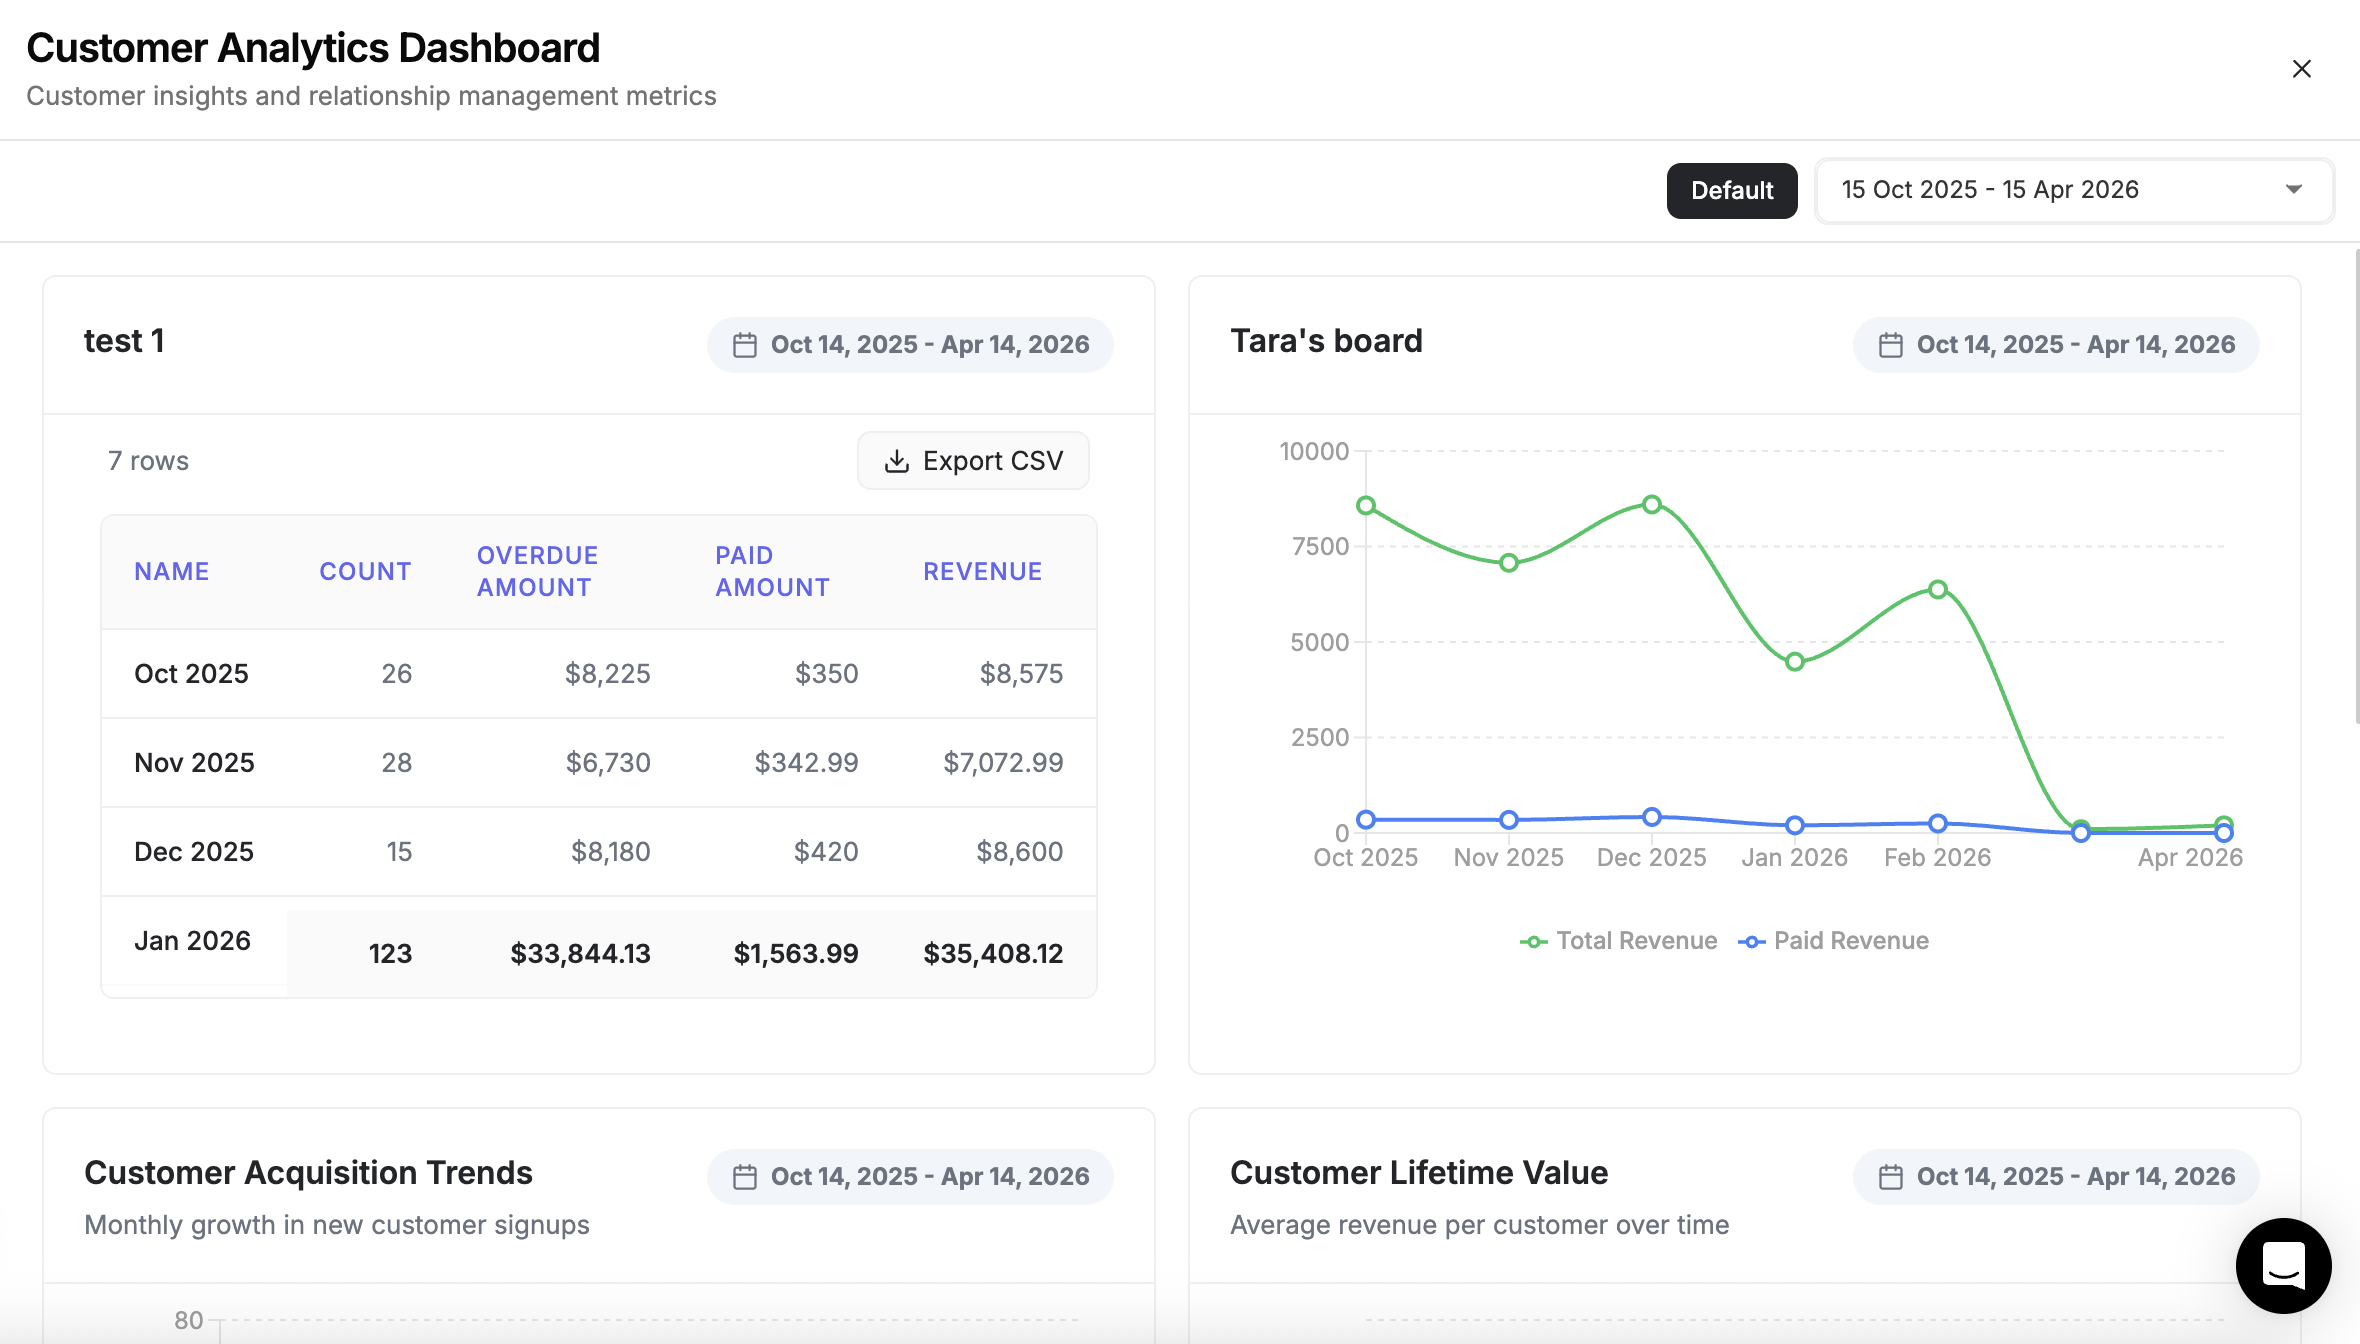
Example Boards by Role
Owner Dashboard
Focus on high-level business health:
- Monthly revenue trend (line chart)
- Customer acquisition rate (stat card)
- Profit margins by service type (bar chart)
- Team utilization rate (stat card)
- Top clients by revenue (table)
Dispatcher Operations Board
Focus on real-time job flow:
- Today's job status breakdown (pie chart)
- Unassigned jobs count (stat card)
- Jobs by time slot (bar chart)
- Route completion status (stat card)
Manager Performance Board
Focus on team efficiency and quality:
- Jobs per technician this week (bar chart)
- Average job duration by type (bar chart)
- First-time fix rate (stat card)
- Skill distribution across team (pie chart)
Sharing Boards with Your Team
Boards you create are visible to other team members who have access to Analytics. This means:
- An owner can build a dashboard and share it with the operations manager
- A dispatcher can create a morning board that the whole office references
- Standard boards can be set up for new hires to use from day one
Board visibility follows your account's team permissions. Members who do not have access to Analytics will not see shared boards.
Managing Boards
- Edit a board — open it, rearrange widgets, or remove ones you no longer need
- Rename a board — update the name and description as your needs change
- Delete a board — remove boards that are no longer relevant
Keep Exploring
Analytics Overview | FieldCamp
Track jobs, revenue, team performance, and client insights from one FieldCamp analytics dashboard with real-time charts, custom boards, and exportable reports.
Custom Data Views | FieldCamp
Create saved filter, sort, and group combinations on any module in FieldCamp. Build custom views for jobs, clients, invoices, and more to find data fast.