 FieldCamp
Analytics Overview | FieldCamp
Track jobs, revenue, team performance, and client insights from one FieldCamp analytics dashboard with real-time charts, custom boards, and exportable reports.
Under the hood — the FieldCamp data model shows how every record connects, how you can customize it, and how it maps to your trade.
FieldCamp Analytics gives you a complete picture of how your field service business is performing. From daily job counts to monthly revenue trends, everything updates in real time so you can spot problems early and double down on what works.
The Fastest Way: Ask the Command Centre
Before navigating menus, open the Command Centre and type what you need:
- "/dashboard" — instantly see your key performance indicators
- "Show me revenue this month"
- "How many jobs did we complete last week?"
- "What's the average job value for April?"
The AI pulls the numbers, builds a summary, and links you to the relevant chart. See AI Skills for the full list of analytics questions you can ask.
Analytics Tabs
When you open Analytics from the sidebar, you see four tabs across the top. Each serves a different purpose:
| Tab | Purpose | Best For |
|---|---|---|
| Overview | Pre-built charts covering jobs, revenue, statuses, and skills | Daily check-ins and quick health checks |
| Playground | Build one-off charts from any metric and filter combination | Exploring data and answering ad-hoc questions |
| Boards | Save Playground charts into custom dashboards | Role-specific dashboards (owner, dispatcher, manager) |
| Reports | Export data as downloadable files for external tools | Accounting, payroll, and presentations |
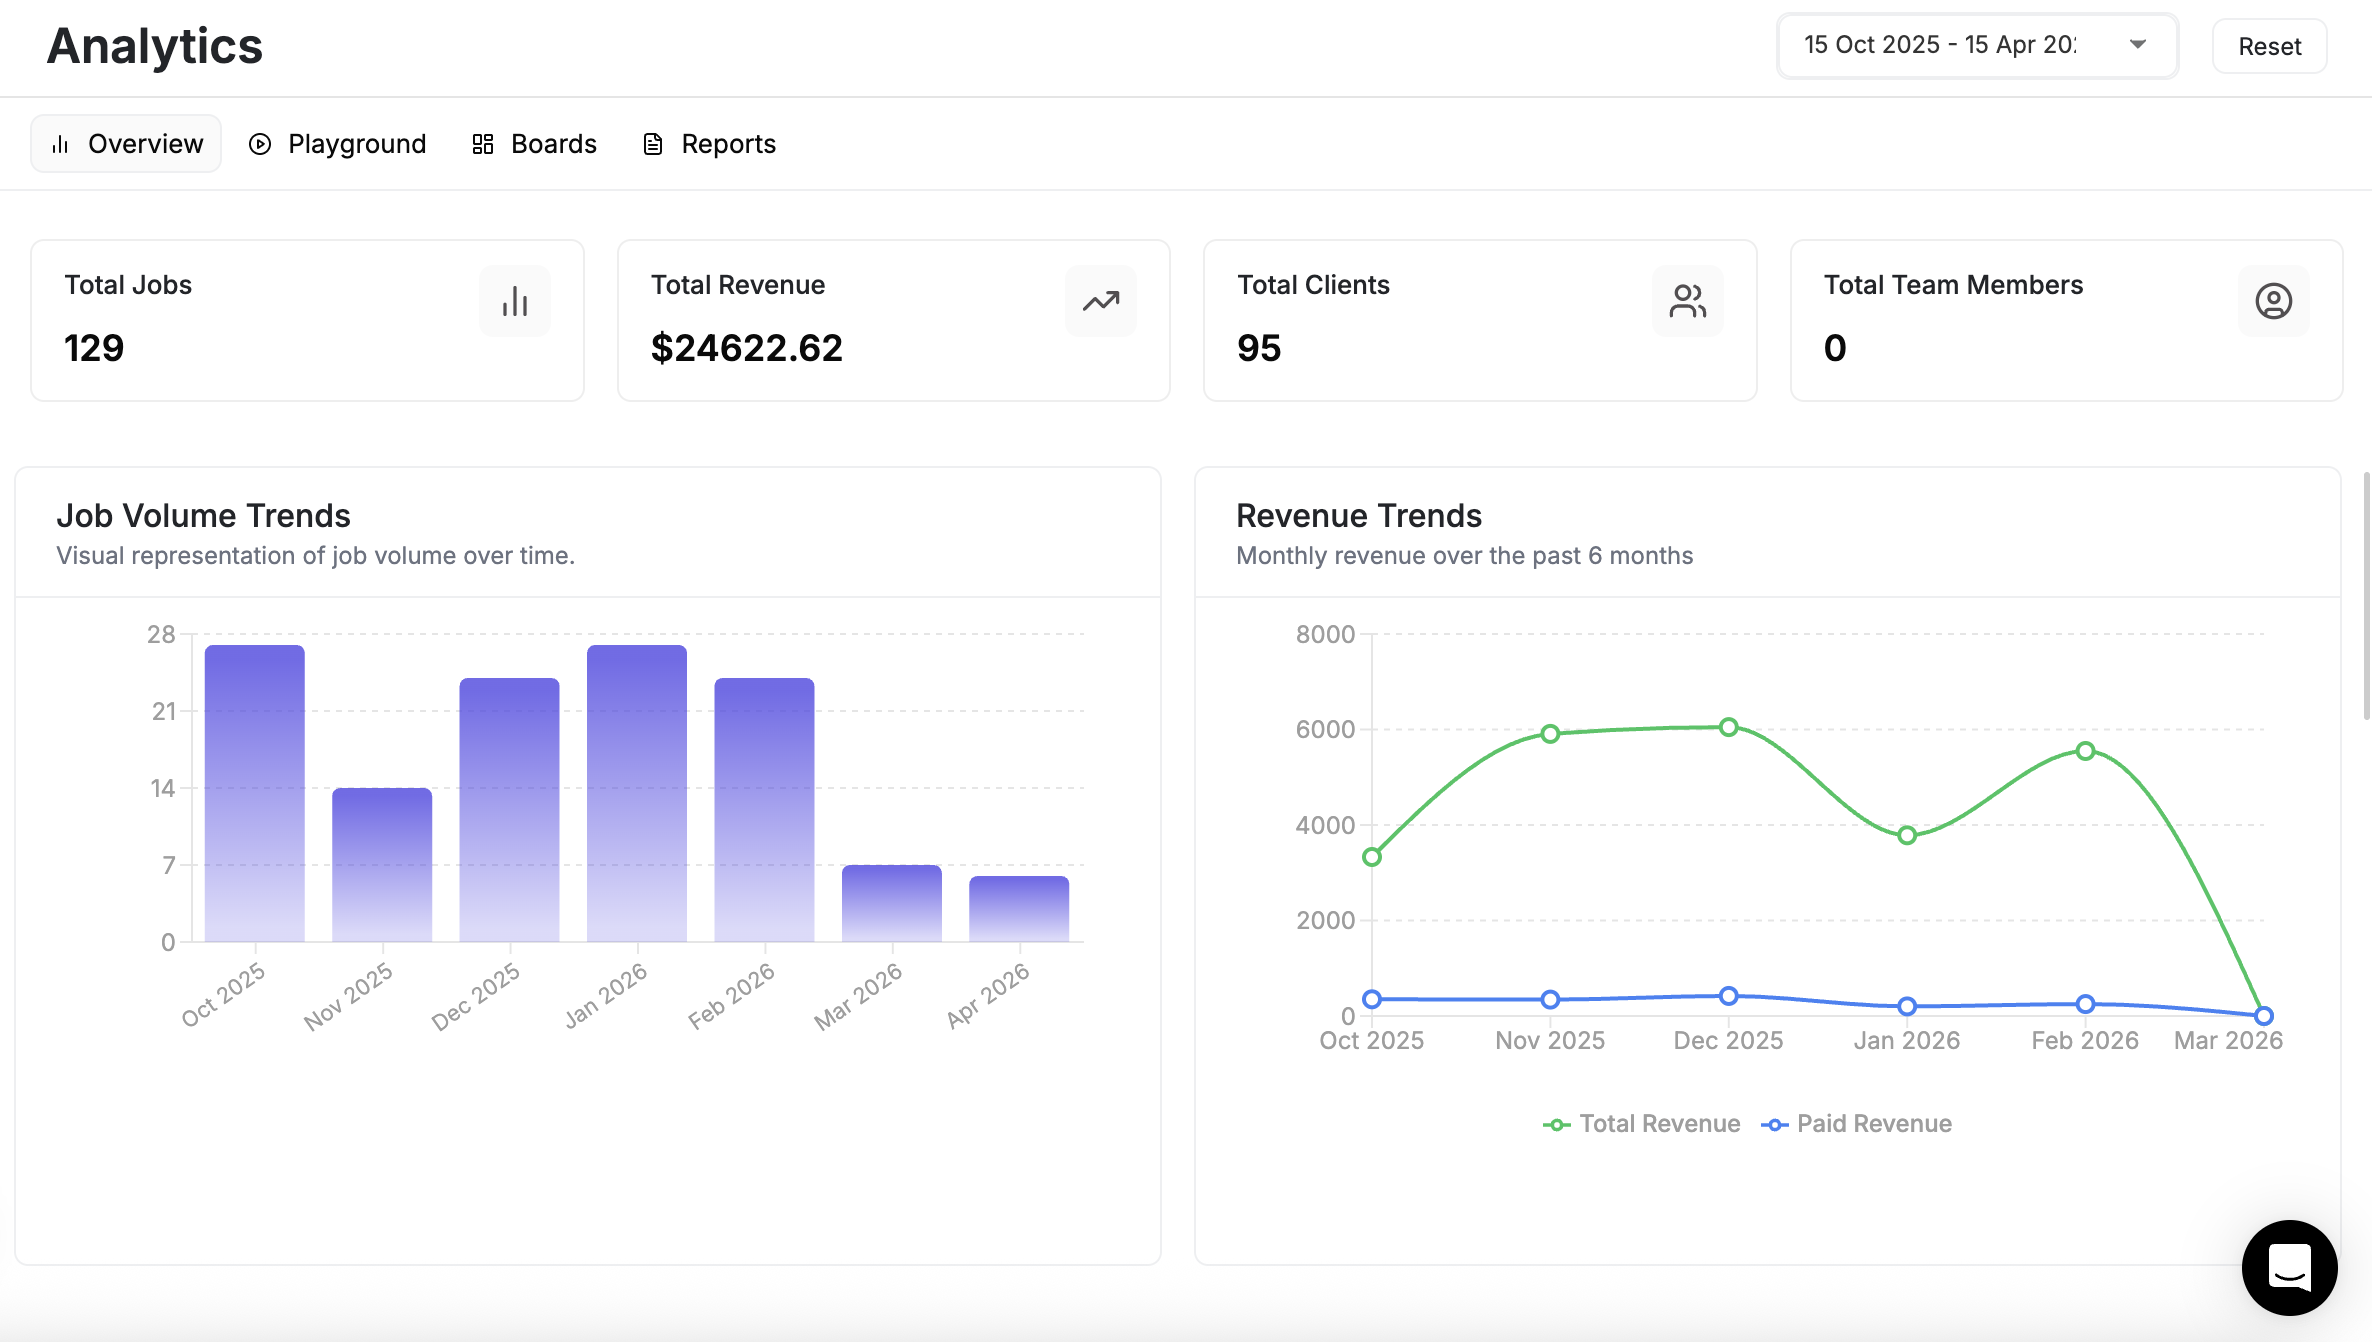
Overview Tab
The Overview tab is your starting point. It displays a set of pre-built charts that refresh automatically:
- Job Volume Trends — see how many jobs are being created and completed over time
- Revenue Trends — track income growth by day, week, or month
- Job Status Distribution — view how jobs are split across Open, In Progress, Completed, and other statuses
- Job Types — compare one-time vs. recurring vs. multi-day work
- Skill Distribution — understand which services your team performs most
Use the date selector in the top-right corner to adjust the time range for all charts at once.
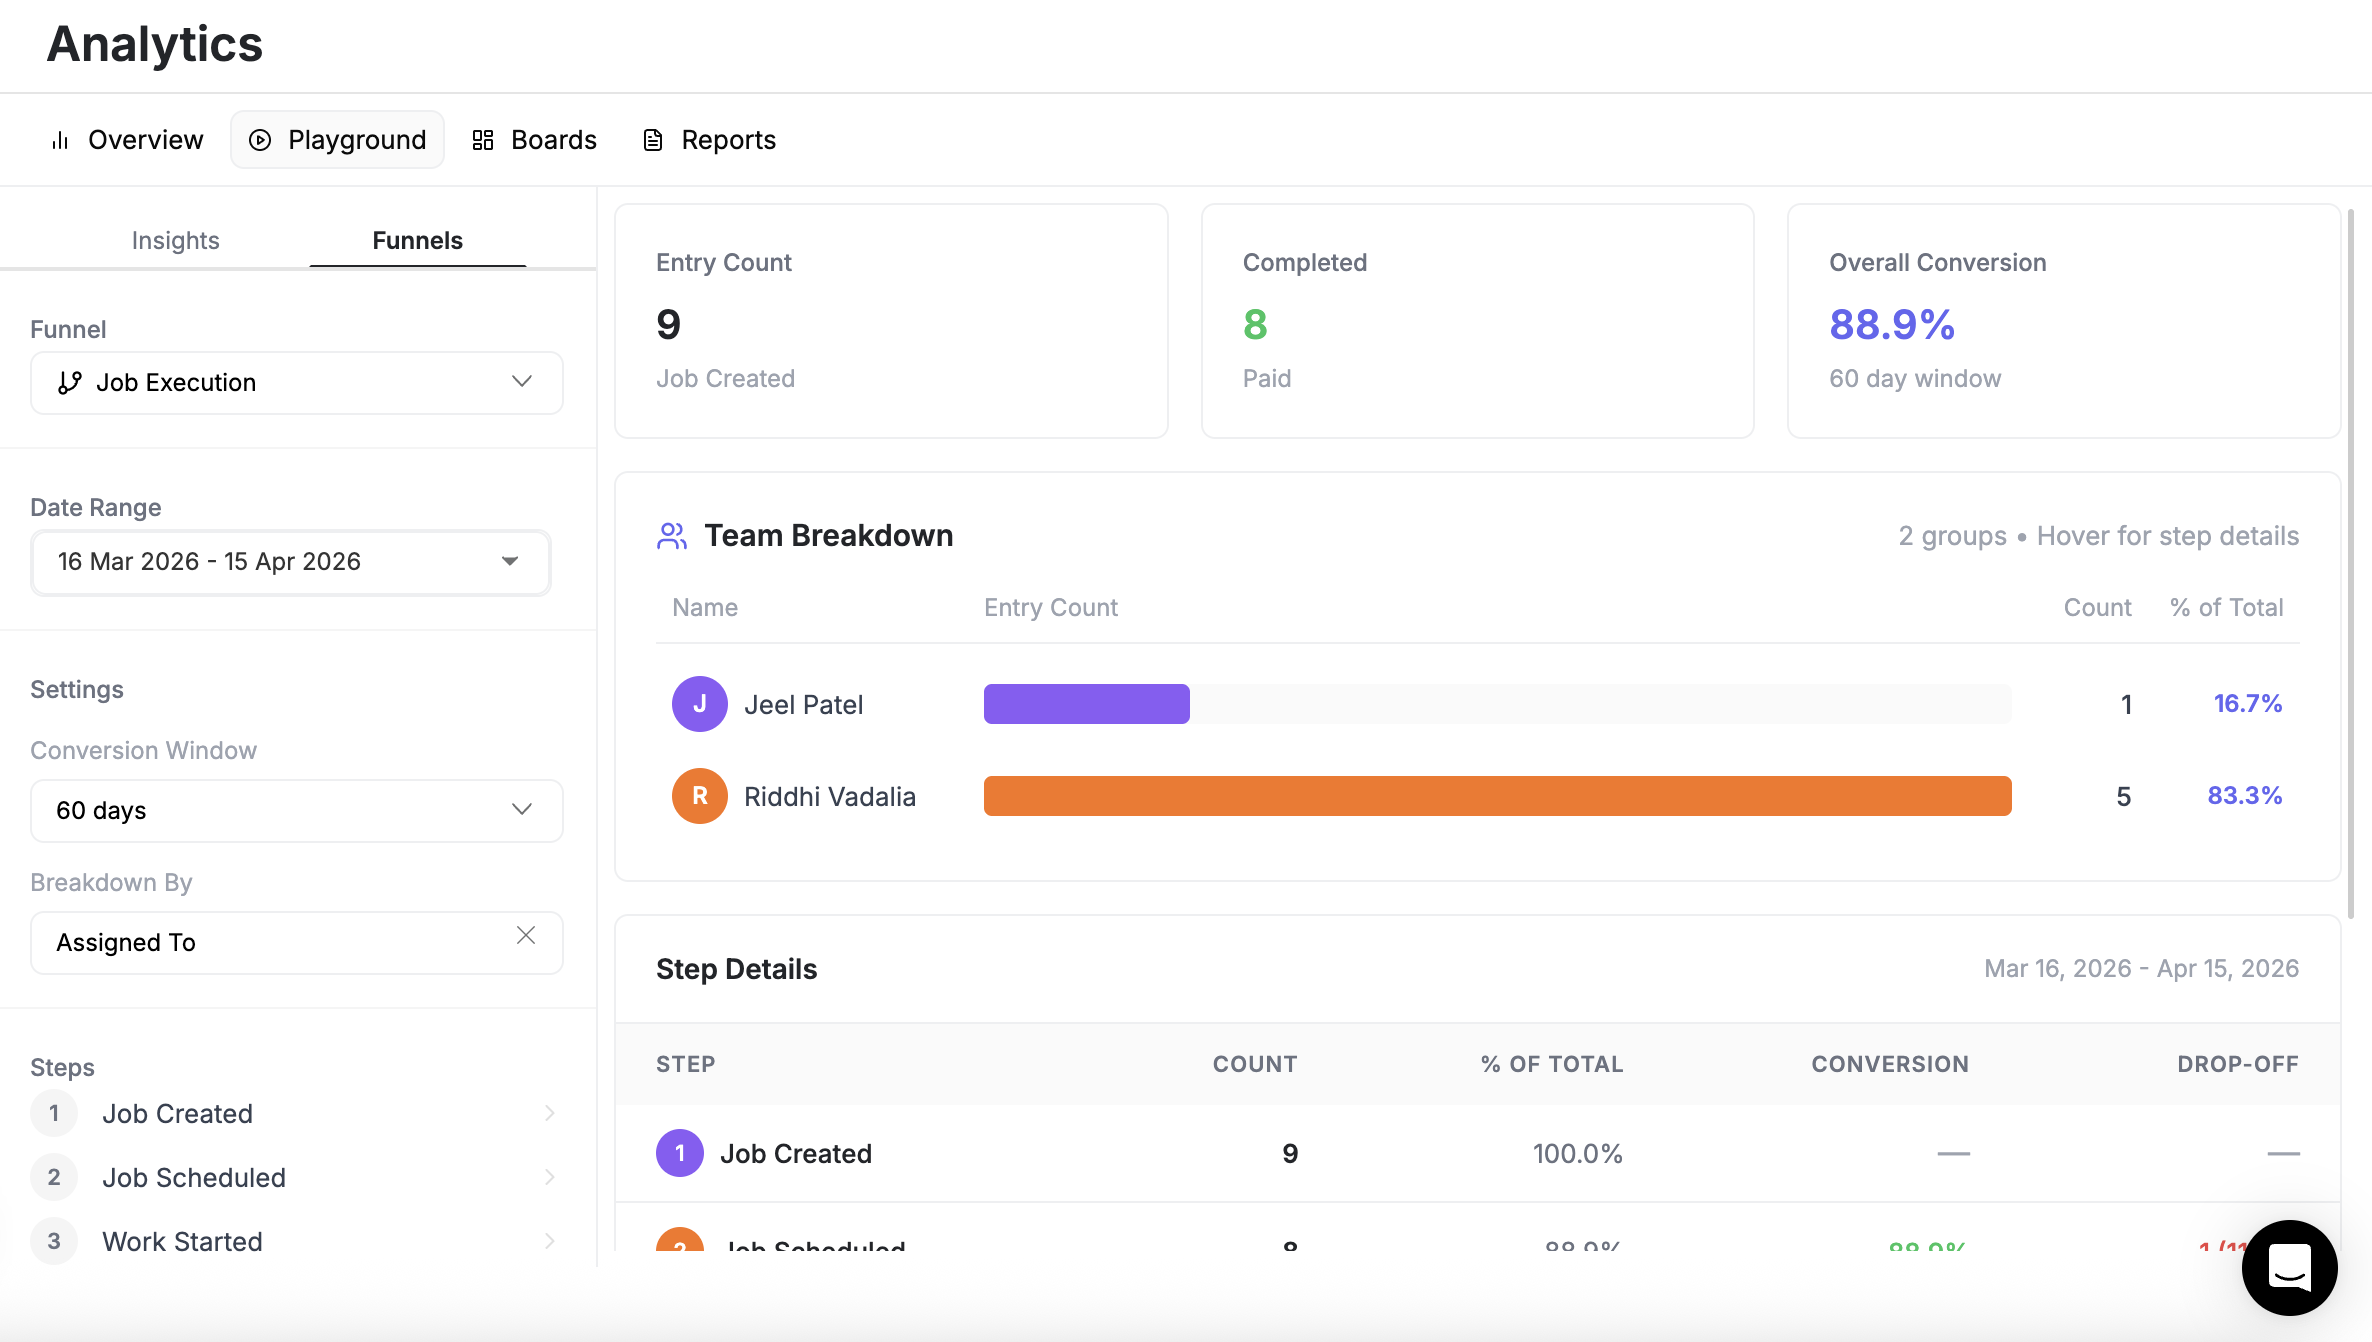
Playground Tab
The Playground lets you build charts from scratch. Pick a metric, choose a chart type (bar, line, pie, or table), and apply filters to see exactly what you need.
Common Playground uses:
- Revenue by team member for a specific month
- Jobs by status filtered to a single client
- Average job duration grouped by service type
Once you build something useful, click Save to Board to keep it on a custom dashboard for ongoing monitoring.
Need a metric that is not listed? Contact support. The analytics library is actively expanding and new data points can be enabled on request.
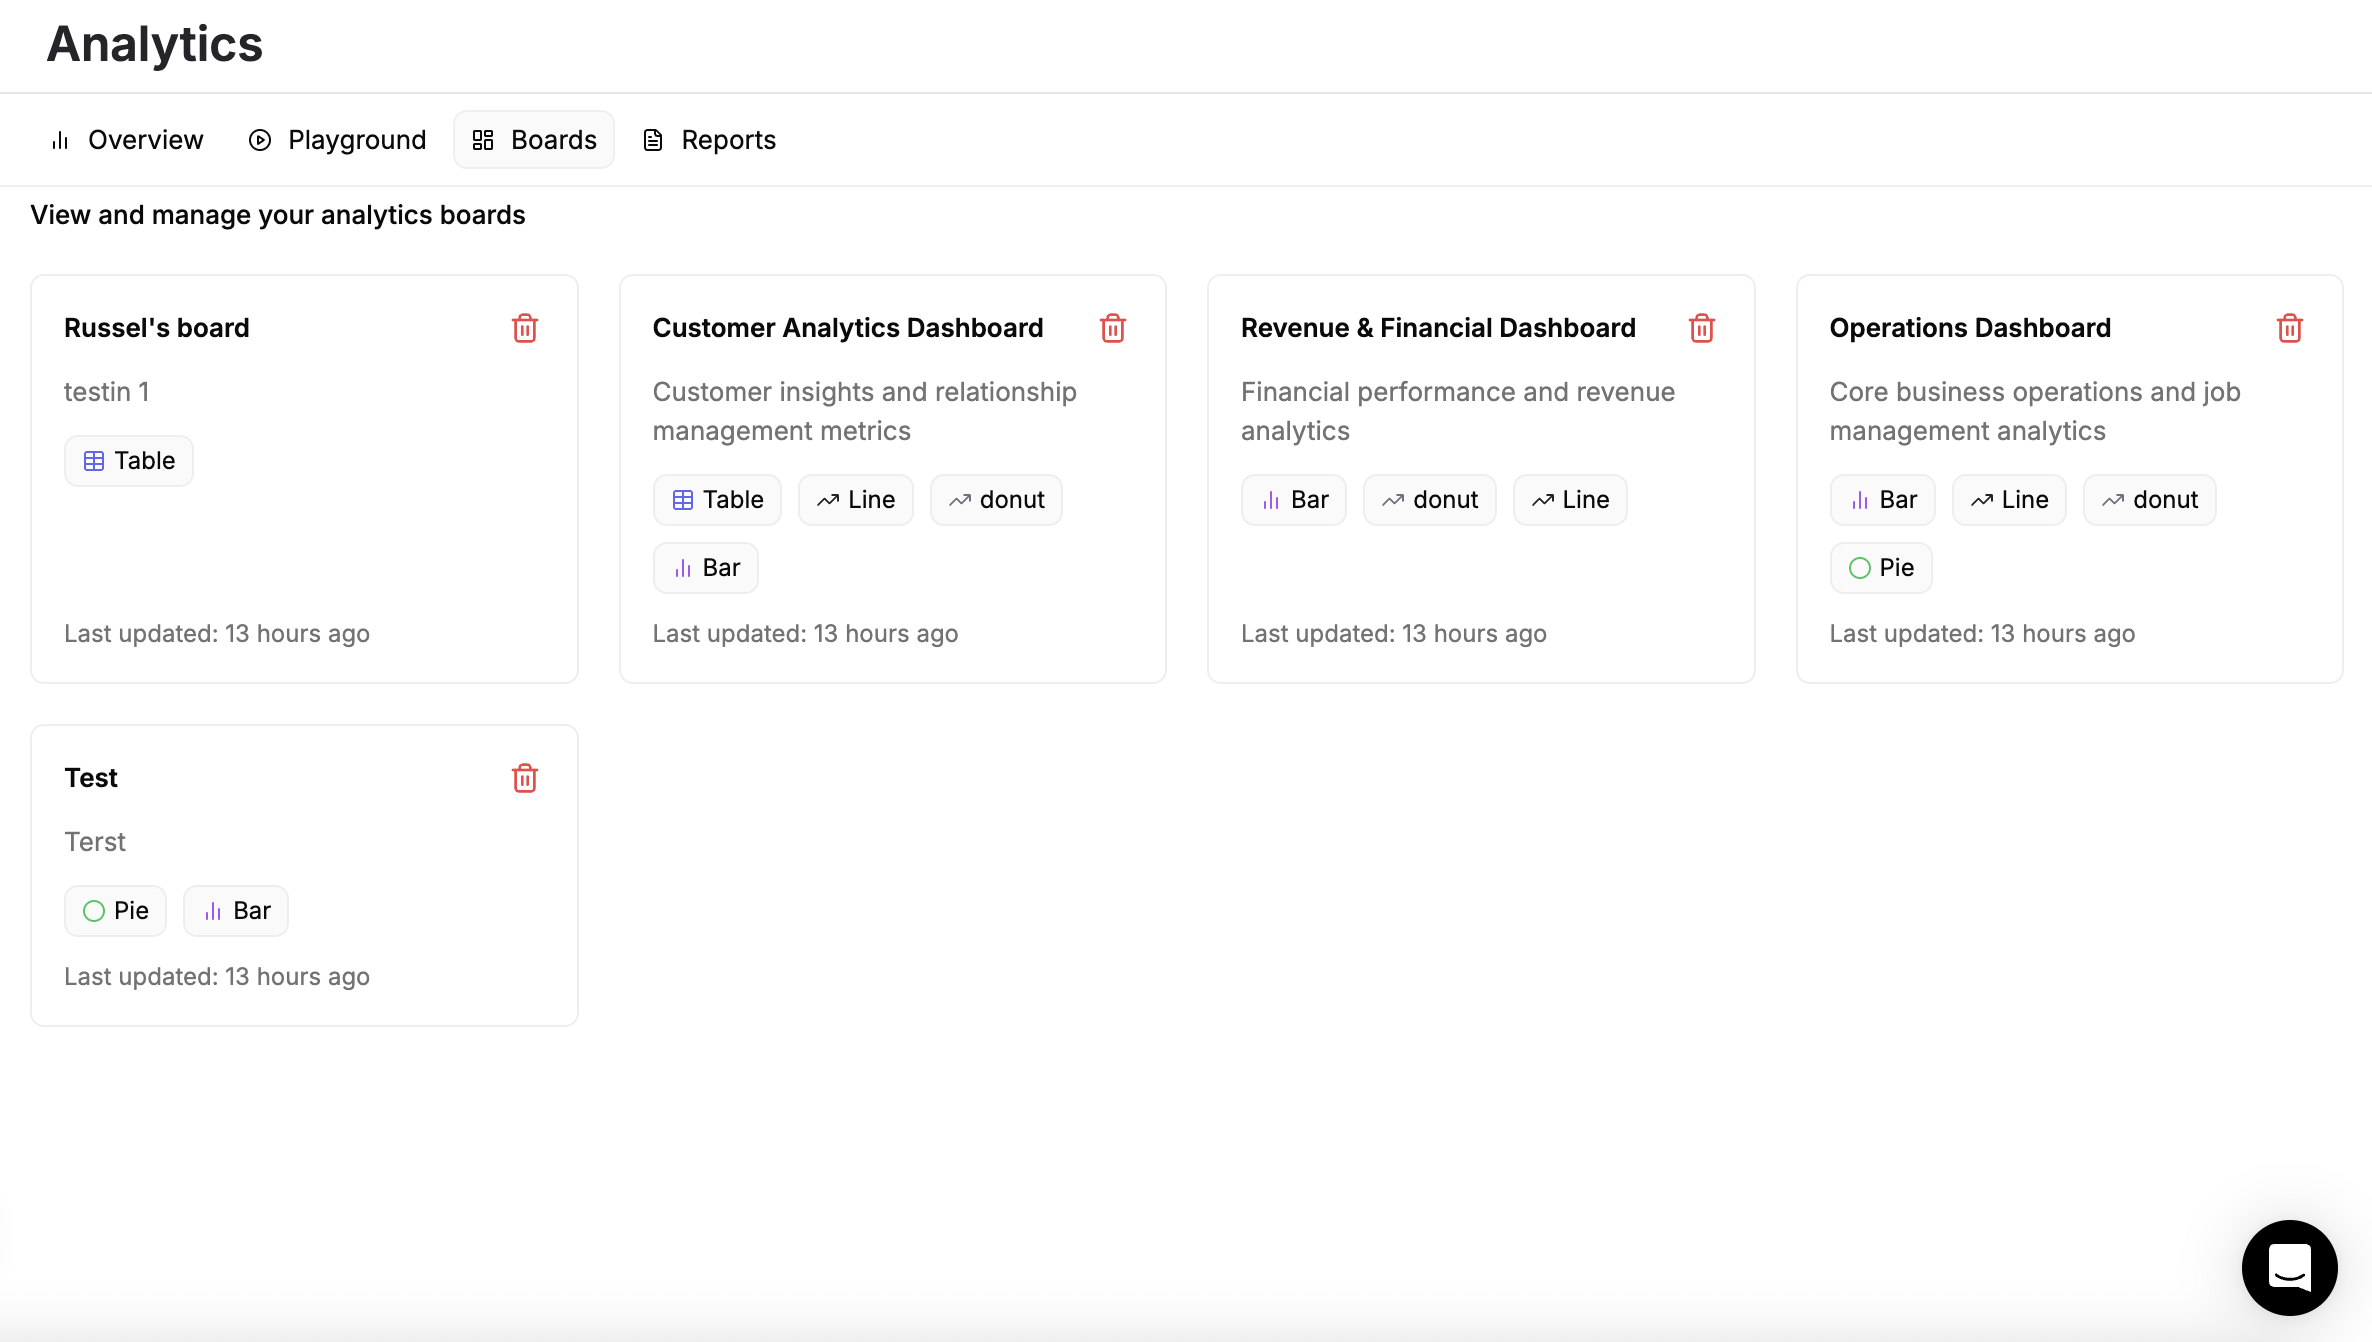
Boards Tab
Boards are custom dashboards you build from Playground charts. Instead of a one-size-fits-all view, create focused dashboards for different roles or goals — an owner's revenue tracker, a dispatcher's daily operations view, or a manager's team performance board.
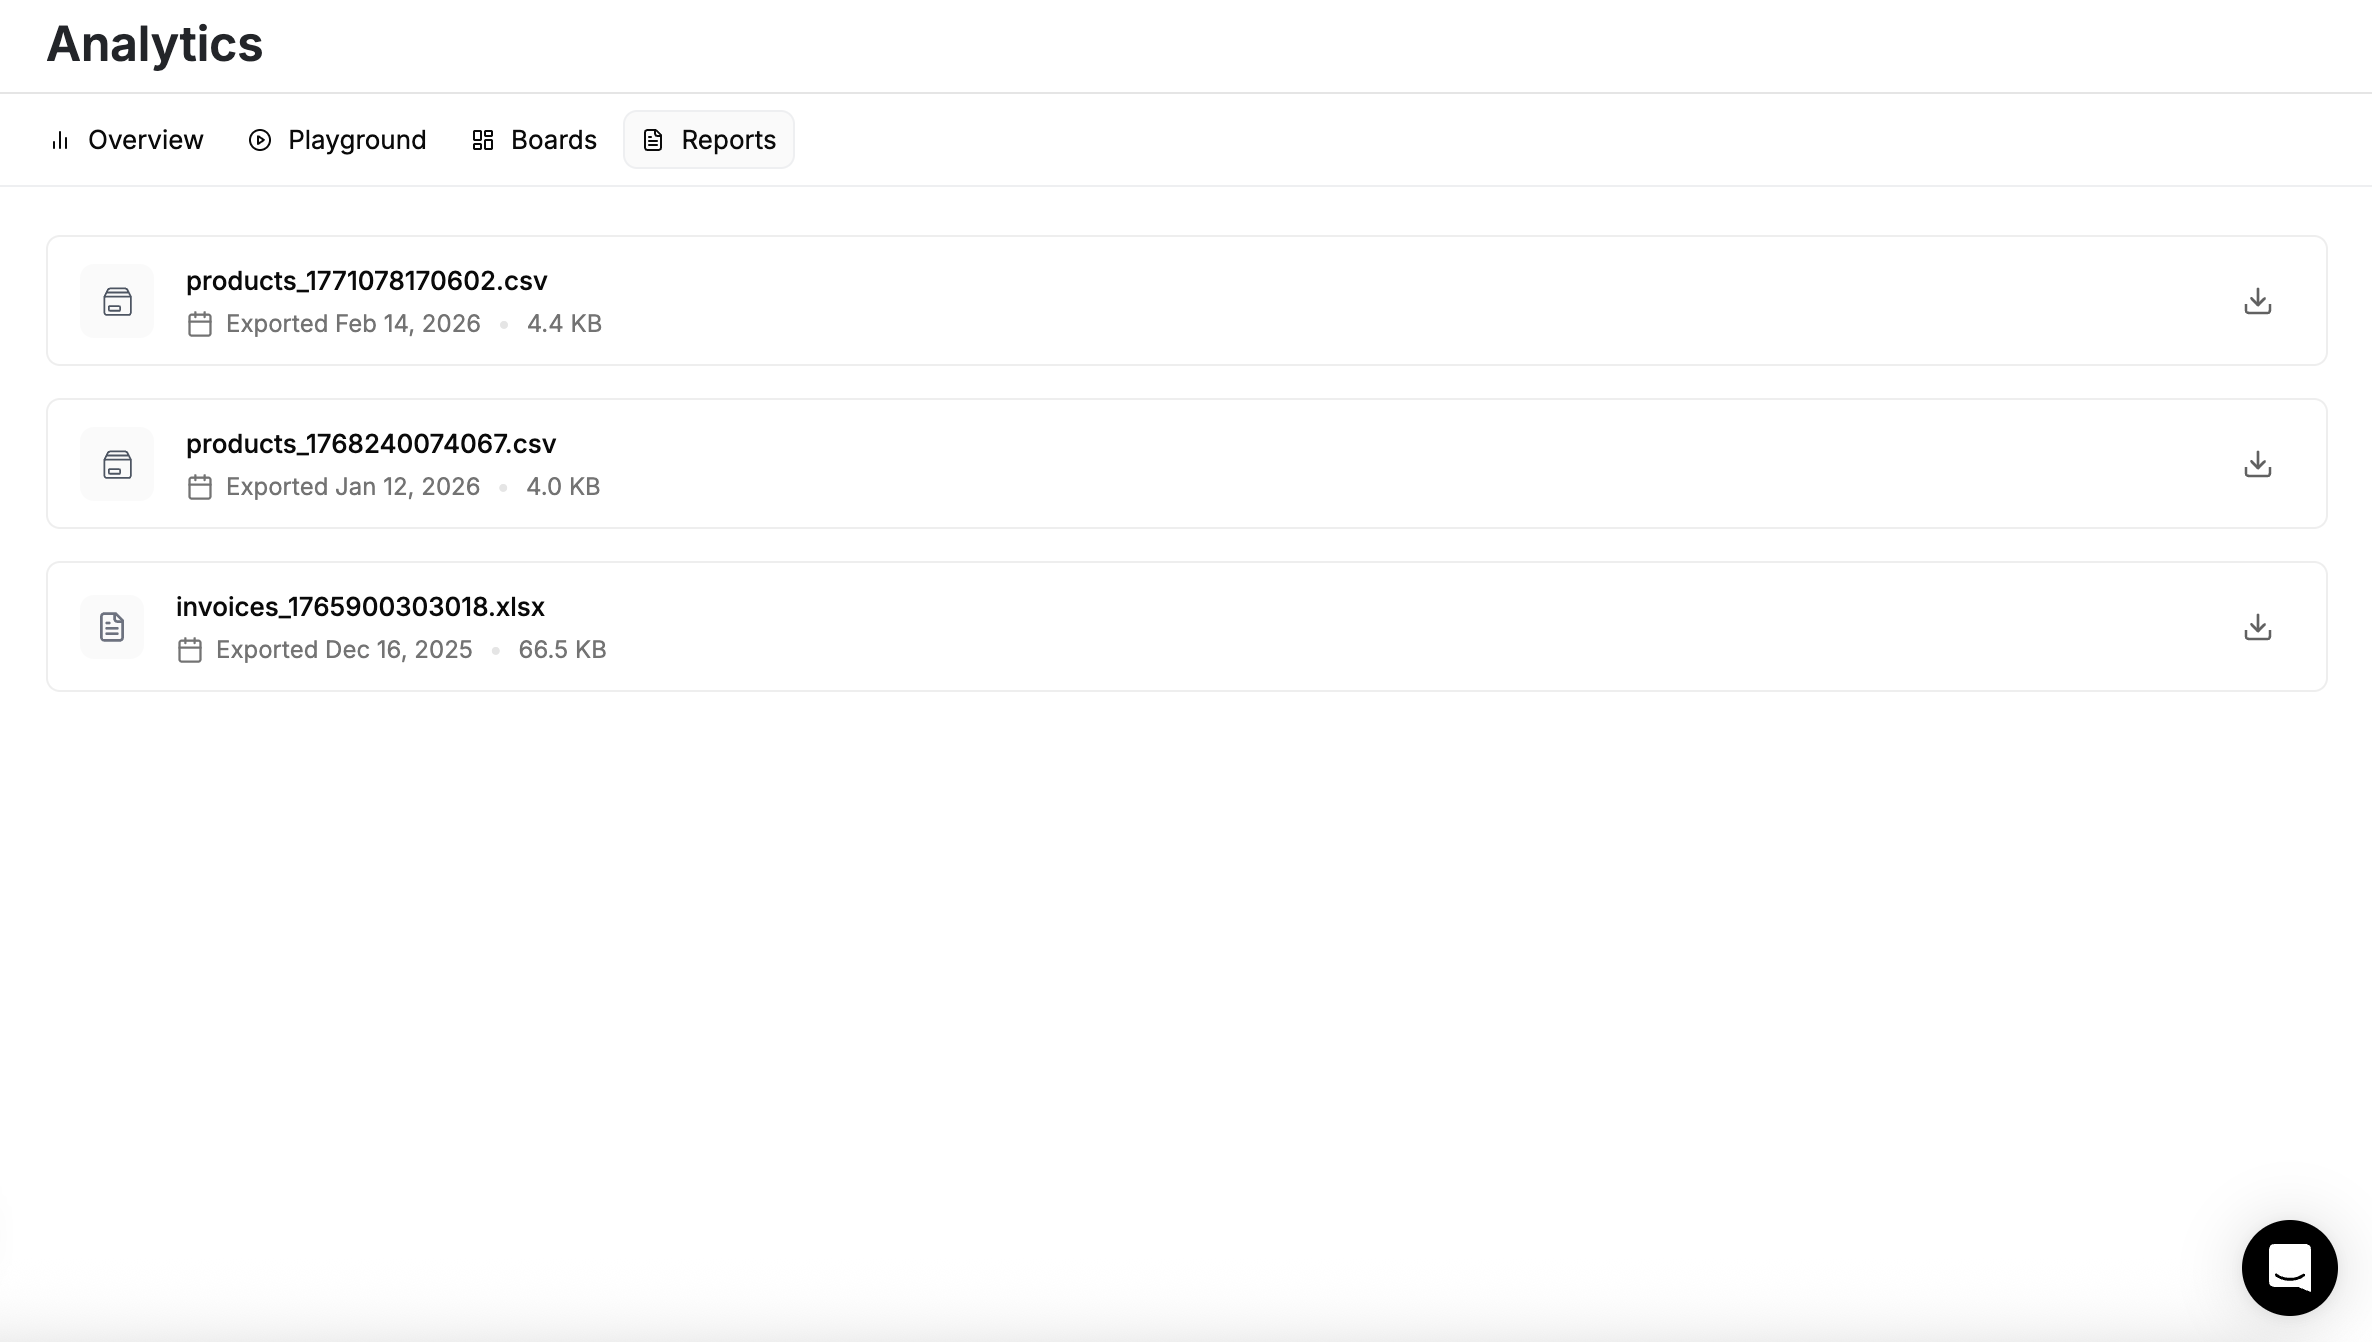
Reports Tab
The Reports tab lets you export data for use outside FieldCamp:
- Jobs — export job records with statuses, dates, and assigned team
- Clients — pull client lists with contact details and job history
- Revenue — download financial summaries for accounting
- Team logs — export labor hours, mileage, and expenses for payroll
Exported files work with Excel, Google Sheets, Power BI, and any tool that reads CSV or spreadsheet formats.
Date Range Filters
Every tab supports date filtering. The default range is the current month, but you can switch to:
- Today, This Week, This Month, This Quarter, This Year
- Custom date range with a start and end date
Changing the date range updates all visible charts and metrics at once.
What You Can Track
| Category | Metrics |
|---|---|
| Jobs | Volume, status breakdown, completion rate, average duration, types |
| Revenue | Total income, revenue by service type, revenue by client, trends |
| Team | Jobs per member, utilization rate, skill usage, labor hours |
| Clients | Active clients, new clients over time, job frequency per client |
| Invoices | Sent vs. paid, overdue amounts, average time to payment |
Keep Exploring
Communication Records | FieldCamp
Every email, call, and text message is automatically logged on the client record. View, filter, and review the full communication history from one page.
Custom Dashboards & Boards | FieldCamp
Build custom dashboards in FieldCamp using boards. Add charts, stat cards, and tables to create role-specific views for owners, dispatchers, and managers.