 FieldCamp
Franchise network performance reporting
Compare revenue, collections, jobs and visits across franchise branches with the HQ dashboard, benchmarks, same-store growth, analytics and saved boards.
Network performance is the reporting area of the franchise console. It rolls up every branch's numbers so HQ can compare branches, spot the ones that need attention and save views for the team. It has three tabs: Dashboard, Analytics and Boards.
Watch: see every branch's numbers in one dashboard
This video tours the network dashboard, benchmarks, Analytics and boards.
Before you begin
- Your franchise role needs View reports, analytics and boards. All built-in roles have it. People with access to some branches only see those branches. See franchise roles and permissions.
- Refresh, creating boards and saving charts need Create and edit boards. Owners and admins have it.
- Department figures need View department reporting. Owners and admins have it.
Read the dashboard
Open the franchise console and select Network performance. The Dashboard tab opens.
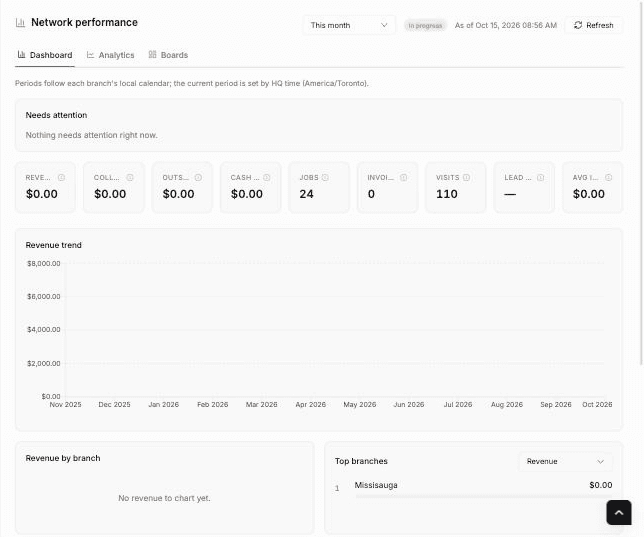
Choose the period
Use the period picker to choose Today, This week, This month, This quarter or This year. Periods follow each branch's local calendar; HQ's time zone decides which period is current. While the period is still open, the dashboard shows In progress because the numbers will change until it closes.
When your network has more than one branch, you can limit the dashboard to some branches. If your branch tree has regions or areas, a Cohort picker lets you compare a group's branches with each other.
Refresh the numbers
The dashboard shows when its numbers were calculated, for example As of a time. If they're older than their freshness window, it shows Data may be out of date — refresh for the latest. The window is 1 hour for Today, 6 hours for This week and 24 hours for longer periods. Click Refresh to recalculate every period for your branches.
Needs attention
This panel flags branches worth checking:
- A branch has no jobs or invoices in the period.
- A branch's revenue is under half the network median.
- The numbers are older than their freshness window.
When nothing applies, it shows Nothing needs attention right now.
KPI cards
Hover a card's info icon for its definition.
| Card | What it counts |
|---|---|
| Revenue | Billed total of invoices created in the period. Drafts, cancelled and deleted invoices are excluded. |
| Collected | Payments applied to this period's invoices, whenever they were paid. |
| Outstanding | Revenue minus collected. |
| Cash received | All payments dated in the period, whichever invoice they pay. |
| Jobs and Visits | Jobs and visits created in the period. |
| Invoices | Invoices counted in revenue. |
| Lead conversion | Converted leads divided by leads assigned to the branch in the period. |
| Avg invoice | Revenue divided by invoices. |
Compare branches
- Revenue trend charts recent periods, for example the last 12 months.
- Revenue by branch shows each branch's share of revenue.
- Top branches ranks branches by the metric you pick (default Revenue).
- Benchmarks shows the 25th percentile, median and 75th percentile for each metric. It needs at least two branches.
- Same-store growth shows month-on-month and year-on-year growth per branch. Network comp (mature branches) only counts branches added at least 12 months ago. Newer branches show their own growth but are excluded from the network figure.
- The branch table lists every KPI per branch. Pctl is where the branch sits among its peers for the metric picked in Top branches, where 50 is the median.
Compare departments
Until departments exist, the dashboard shows Set up departments. See roll out departments across branches. Once they do, switch between By branch and By department.
By department compares each department across branches. Records without a department show as Unassigned, so each branch total equals its departments plus Unassigned. Revenue, collected and invoices follow the invoice's department; jobs and visits follow their own. The How departments were decided card shows how bookings got their department over the last 30 days.
Explore metrics in Analytics
On the Analytics tab, choose Metrics or Funnels.
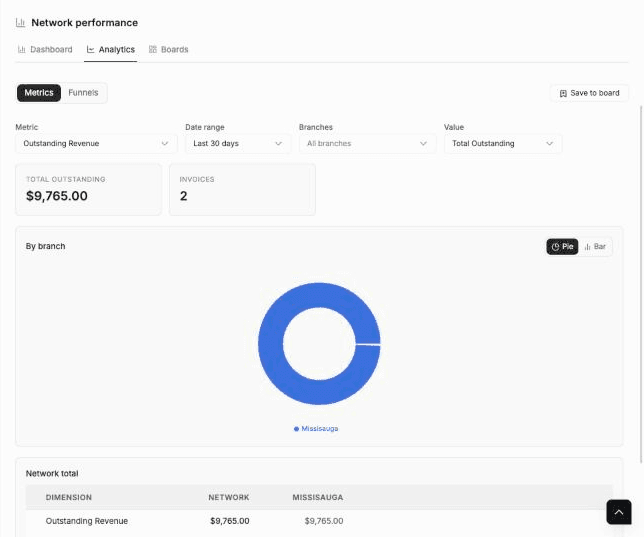
- Metrics: pick a Metric, a Date range, Branches and a Value. Metrics are grouped as Financial, Jobs & Visits, CRM & Pipeline, Estimates, Inventory, Tasks & Workflows and Workforce. You get totals, a By branch chart you can switch between chart types such as Pie and Bar, and a Network total table with a column per branch.
- Funnels: the Sales Pipeline funnel runs from request created to invoice paid. You see Entered, Completed and Conversion, a By branch chart and a Funnel steps table.
Some metrics can't be added up across branches. Analytics shows these per branch instead of combining them.
For the single-workspace equivalent, see analytics in FieldCamp.
Save a view to a board
Set up the view
On Analytics, choose the metric or funnel, filters and chart type you want to keep.
Click Save to board
Click Save to board. It's unavailable for metrics that can't be combined across branches.
Name the chart and pick a board
Enter a Chart title. Select a board, or choose Create new board and enter a New board name.
Save
Save the chart. FieldCamp confirms with Chart saved to board.
The Boards tab lists your saved boards with their scope, who they're shared with, chart count and last update. Opening a board renders its charts live for each branch you can reach. Use the row menu to Duplicate or Delete a board. Deleting archives it for everyone in the network.
Related articles
Work with HQ standards in a franchise branch
See how HQ-managed records look in a FieldCamp branch, what your branch can edit, how to propose a change to HQ and what an HQ push does to your edits.
Franchise modules, purchase orders and audit log
Turn franchise HQ modules on or off, set the purchase order price variance tolerance for branches, and review or export the franchise audit log.